
A complete beginner-first the field covering Python, SQL, statistics, EDA, machine learning, deep learning, projects and interview preparation. Work through the the field for Beginners examples in order, then change one assumption and explain whether your interpretation still holds.
Editorial note: Publication metadata for Data Science Tutorial for Beginners is intentionally unset until this URL is actually released; the lesson already includes its own examples, CSV and notebook.
Understand the role of the field in the data-science workflow
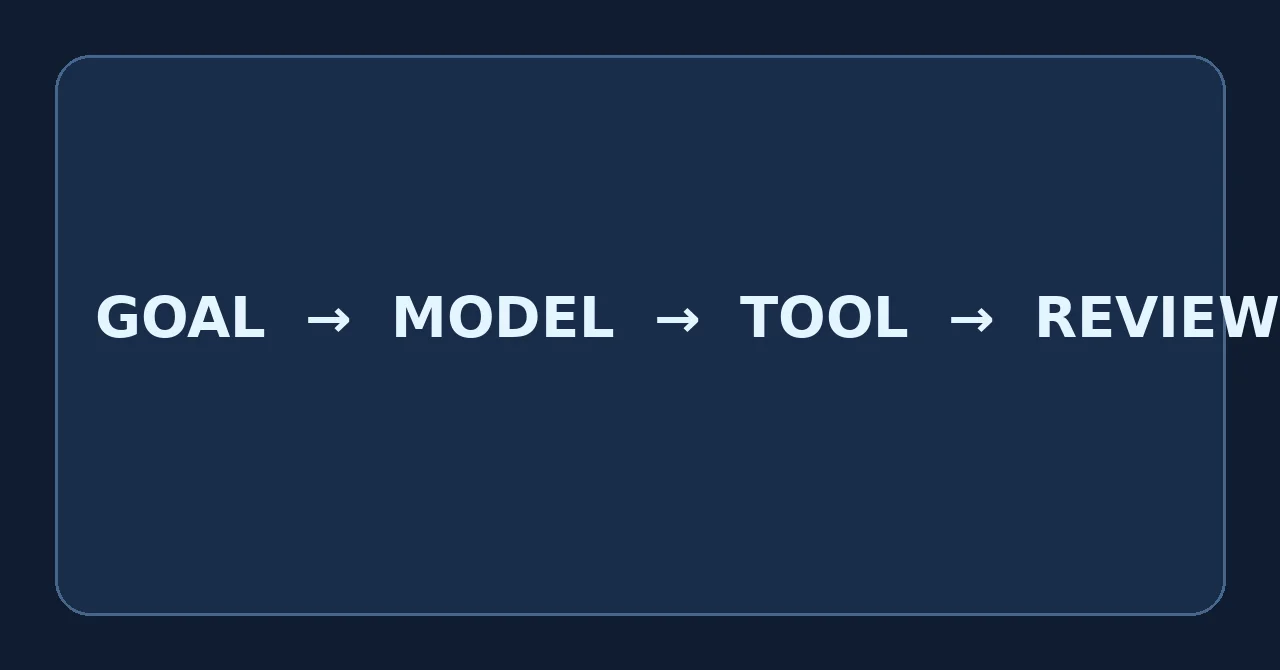
Imagine a retail team trying to reduce stockouts. A useful data science workflow would collect transaction history, clean missing product records, explore seasonality, build a demand baseline, test a forecasting model and measure whether the recommendations actually reduce missed sales.
- In real analysis, the field is valuable because it makes one part of the pipeline explicit.
- Data science combines programming, statistics, domain knowledge and experimentation to turn raw data into decisions.
- Record the choice you made, why you made it and what evidence would make you change it.
- A practical learning order starts with data handling and Python, then SQL, statistics, visualization, machine learning and finally deployment-oriented projects.
Connect the idea to a concrete decision
For the field for Beginners, predict one visible result before each snippet runs—a row count, shape, statistic, ranking or error pattern—then compare it with the printed checkpoint.
# A tiny end-to-end data-science sketch
import pandas as pd

df = pd.DataFrame({'sales':[120,150,90,210], 'promo':[0,1,0,1]})
print(df.describe())
print(df.groupby('promo')['sales'].mean())the field for Beginners checkpoint 1: Run the cell and inspect the printed values before changing anything.
# the field for Beginners · example 2
import pandas as pd

df = pd.read_csv('practice.csv')
print(df.shape)
print(df.dtypes)
print(df.head(3).to_string(index=False))the field for Beginners checkpoint 2: (30, 5) Column types are printed, followed by the first three rows.
# the field for Beginners · example 3
missing = df.isna().sum().sort_values(ascending=False)
print(missing[missing.gt(0)])the field for Beginners checkpoint 3: Only columns with at least one missing value are listed.
# the field for Beginners · example 4
summary = df.select_dtypes('number').agg(['count','mean','median','min','max']).T
print(summary.round(2))the field for Beginners checkpoint 4: A compact numeric summary appears with one row per numeric column.
# the field for Beginners · example 5
test = df.copy()
if len(test):
    test.iloc[0, 0] = test.iloc[0, 0]
print('rows:', len(test), 'duplicates:', test.duplicated().sum())the field for Beginners checkpoint 5: The row count and duplicate count make the check visible instead of implicit.
Use a small reproducible example
Record the choice you made, why you made it and what evidence would make you change it.
A practical learning order starts with data handling and Python, then SQL, statistics, visualization, machine learning and finally deployment-oriented projects.
Self-check with answers
For the field for Beginners, what result should you be able to explain without the code?
In real analysis, the field is valuable because it makes one part of the pipeline explicit.
Which assumption matters most in this the field for Beginners exercise?
Record the choice you made, why you made it and what evidence would make you change it.
What failure mode would make this the field for Beginners result untrustworthy?
A practical learning order starts with data handling and Python, then SQL, statistics, visualization, machine learning and finally deployment-oriented projects.
Check your understanding with a changed input
Try it yourself workspace
Edit this the field for Beginners starter, copy it, and run it in the downloadable notebook or your local Jupyter environment.
Questions specific to this lesson
Why is Data Science useful in data science?
In real analysis, the field is valuable because it makes one part of the pipeline explicit.
What should a beginner understand first?
Data science combines programming, statistics, domain knowledge and experimentation to turn raw data into decisions.
What is an easy way to practise it?
Use the downloadable dataset and notebook, predict one result before running the code, then change one input and explain why the output changes.
What mistake should I avoid?
A practical learning order starts with data handling and Python, then SQL, statistics, visualization, machine learning and finally deployment-oriented projects.
Primary references and further reading
For the field for Beginners, use these primary references when exact syntax, defaults or formal definitions matter beyond the examples on this page.