Learn structured, semi-structured and unstructured data with examples, storage choices and preprocessing considerations. For Types of Data, the examples stay small enough for you to predict the result before execution. This page targets the practical intent behind data types, not repetition of the phrase itself.
Editorial note: Publication metadata for Types of Data is intentionally unset until this URL is actually released; the lesson already includes its own examples, CSV and notebook.
Understand the role of data types in the data-science workflow
A fraud-detection system may combine structured transaction amounts, semi-structured device events and unstructured support notes. The modeling pipeline should keep the sources separate long enough to validate each one before joining features.
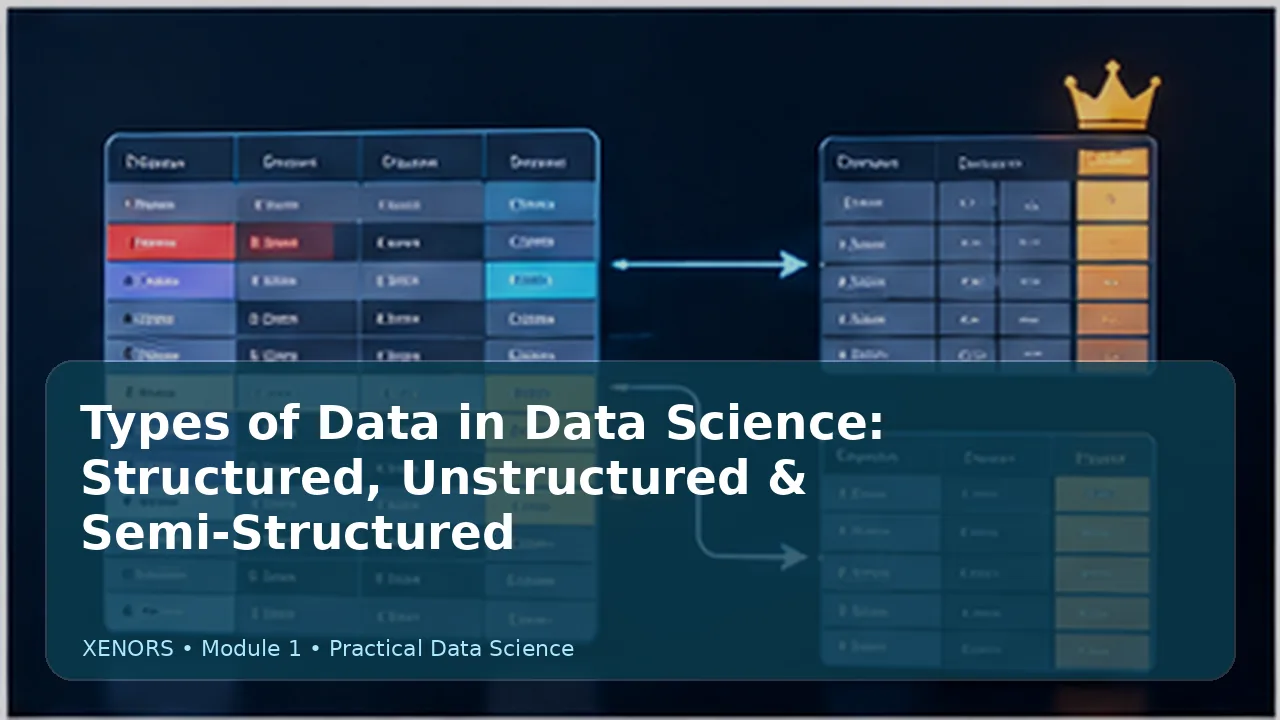
- Structured data fits a defined schema such as rows and columns, while unstructured data includes text, images, audio and other formats without a fixed tabular shape.
- Semi-structured formats such as JSON and event logs carry keys or tags but can vary from record to record.
- Measurement scale matters: nominal, ordinal, interval and ratio variables support different summaries and mathematical operations.
- Before modeling, identify the unit of observation and data type because encoding a category as a number does not make it truly numeric.
Connect the idea to a concrete decision
For Types of Data, predict one visible result before each snippet runs—a row count, shape, statistic, ranking or error pattern—then compare it with the printed checkpoint.
# Types of Data · example 1
record = {
  'structured': {'id': 101, 'revenue': 2499.0},
  'semi_structured': {'event':'purchase','items':[3,8]},
  'unstructured': 'customer review text'
}
for kind, value in record.items():
print(kind, type(value).__name__)Types of Data checkpoint 1: Run the cell and inspect the printed values before changing anything.
# Types of Data · example 2
import pandas as pd

df = pd.read_csv('practice.csv')
print(df.shape)
print(df.dtypes)
print(df.head(3).to_string(index=False))Types of Data checkpoint 2: (30, 5) Column types are printed, followed by the first three rows.
# Types of Data · example 3
missing = df.isna().sum().sort_values(ascending=False)
print(missing[missing.gt(0)])Types of Data checkpoint 3: Only columns with at least one missing value are listed.
# Types of Data · example 4
summary = df.select_dtypes('number').agg(['count','mean','median','min','max']).T
print(summary.round(2))Types of Data checkpoint 4: A compact numeric summary appears with one row per numeric column.
# Types of Data · example 5
test = df.copy()
if len(test):
    test.iloc[0, 0] = test.iloc[0, 0]
print('rows:', len(test), 'duplicates:', test.duplicated().sum())Types of Data checkpoint 5: The row count and duplicate count make the check visible instead of implicit.
Use a small reproducible example
Measurement scale matters: nominal, ordinal, interval and ratio variables support different summaries and mathematical operations.
Before modeling, identify the unit of observation and data type because encoding a category as a number does not make it truly numeric.
Self-check with answers
For Types of Data, what result should you be able to explain without the code?
Structured data fits a defined schema such as rows and columns, while unstructured data includes text, images, audio and other formats without a fixed tabular shape.
Which assumption matters most in this Types of Data exercise?
Measurement scale matters: nominal, ordinal, interval and ratio variables support different summaries and mathematical operations.
What failure mode would make this Types of Data result untrustworthy?
Before modeling, identify the unit of observation and data type because encoding a category as a number does not make it truly numeric.
Check your understanding with a changed input
Try it yourself workspace
Edit this Types of Data starter, copy it, and run it in the downloadable notebook or your local Jupyter environment.
Questions specific to this lesson
Why is data types useful in data science?
Structured data fits a defined schema such as rows and columns, while unstructured data includes text, images, audio and other formats without a fixed tabular shape.
What should a beginner understand first?
Semi-structured formats such as JSON and event logs carry keys or tags but can vary from record to record.
What is an easy way to practise it?
Use the downloadable dataset and notebook, predict one result before running the code, then change one input and explain why the output changes.
What mistake should I avoid?
Before modeling, identify the unit of observation and data type because encoding a category as a number does not make it truly numeric.
Primary references and further reading
For Types of Data, use these primary references when exact syntax, defaults or formal definitions matter beyond the examples on this page.